Santa Clara County Analysis

Our first successful implementation of algorithmic redistricting

Silicon Valley's Fair Districts

Santa Clara County is a diverse region of California and home to over 1.9 million people across 15 cities including San Jose, the city of Santa Clara, Sunnyvale, and Palo Alto. Our analysis represents the first comprehensive algorithmic redistricting study for this important region.

50000 Maps Generated
100 Plans Chosen
2000000 Residents
50000 Maps Generated

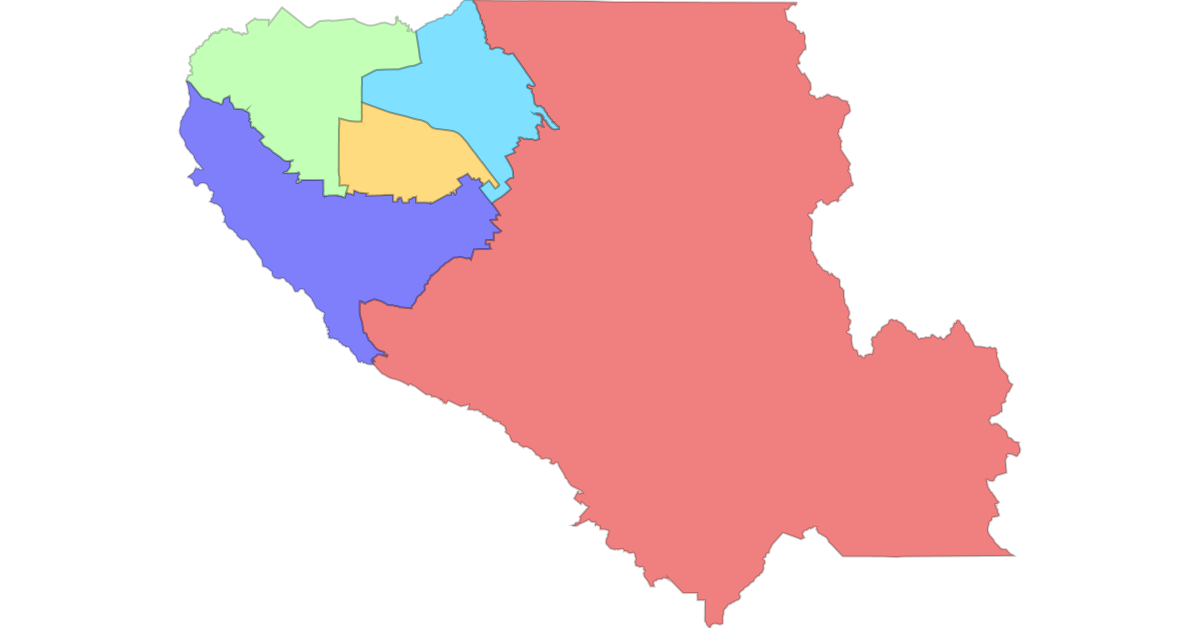
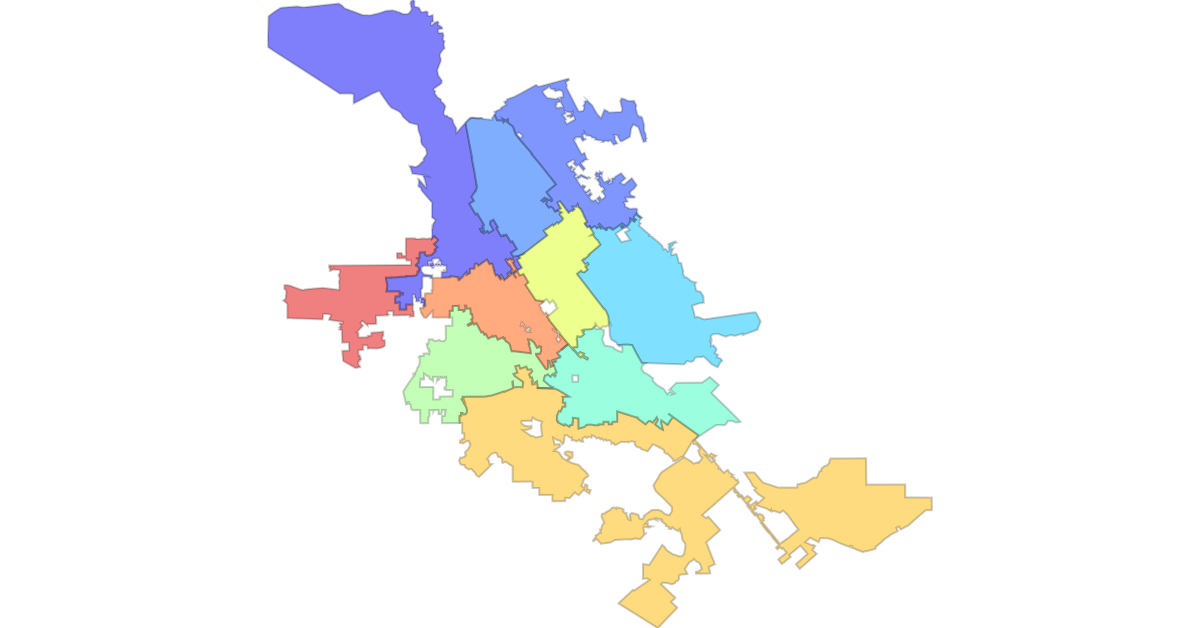
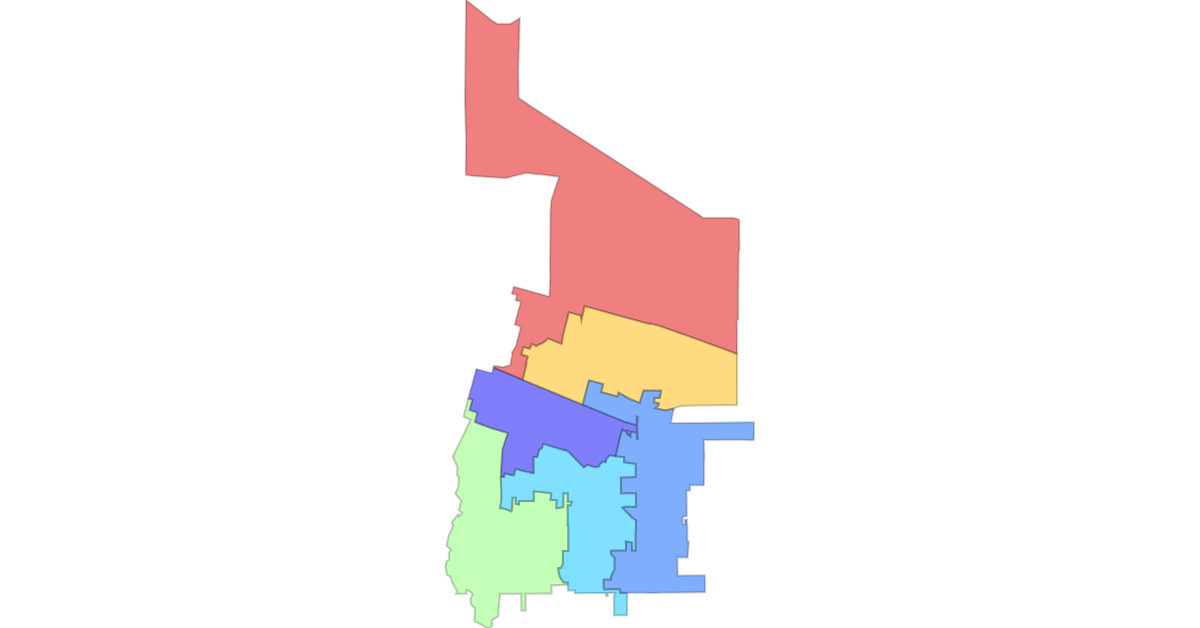
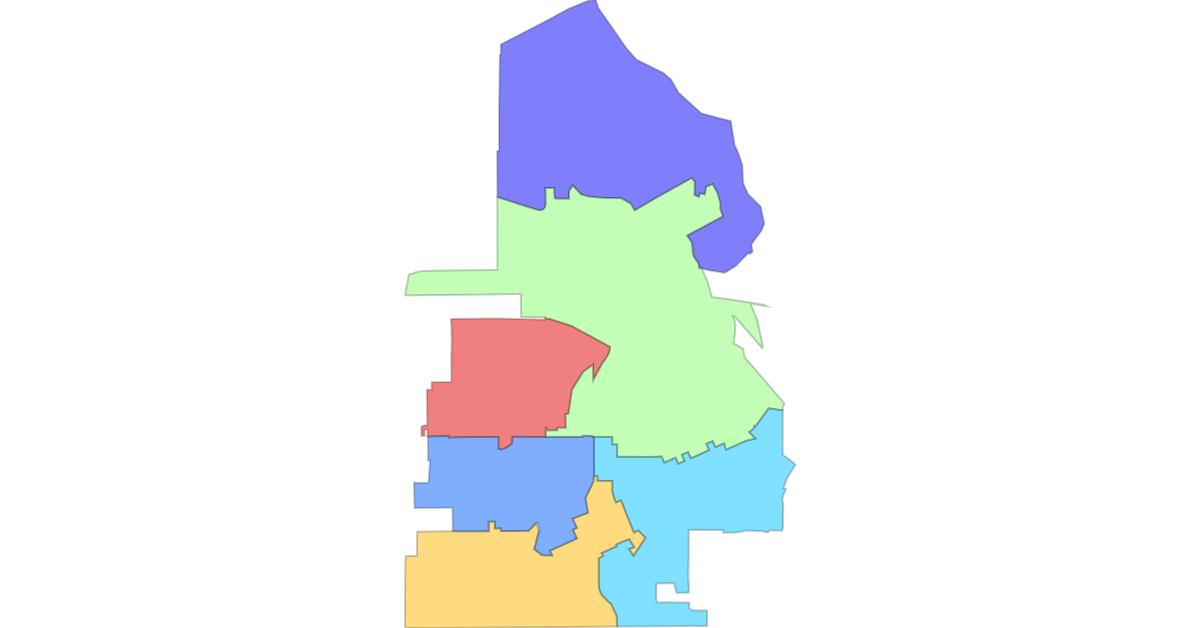
Our algorithm created thousands of possible redistricting plans for each jurisdiction

Santa Clara County Map

Current District Structure

  • Multi-level system: Santa Clara County has different district structures at county, city, and local levels
  • District-based elections: Some jurisdictions use geographic districts to ensure direct community representation
  • At-large systems: Other jurisdictions elect representatives from the entire area (at-large elections), which can lead to overrepresentation of certain areas
  • Complex governance: The mix of systems creates challenges for fair representation across the county
  • Community impact: District-based systems can lead to gerrymandering if not done fairly, whereas at-large systems can leave some communities without a voice

Santa Clara County Board

Districts: 5 districts
Status: District-based elections

Each district represents approximately 380,000 residents

San Jose City Council

Districts: 10 districts
Status: District-based elections

Each district represents approximately 100,000 residents

City of Santa Clara

Districts: 6 districts
Status: District-based elections

Each district represents approximately 20,000 residents

Sunnyvale

Districts: 6 districts
Status: District-based elections

Each district represents approximately 25,000 residents

Other Cities

Districts: No districts
Status: At-large elections

Palo Alto, Mountain View, Cupertino, and other cities use at-large systems

Why This Matters: District-based elections ensure that different geographic areas and communities have direct representation. At-large systems can result in certain areas being overrepresented while others are left without a voice.

Our Analysis Results

We applied our algorithmic redistricting methodology to each jurisdiction with district-based elections, generating thousands of possible plans and selecting the fairest options for each level of government.

50,000+ Plans Generated

Our algorithm created over 50,000 different redistricting plans for each jurisdiction, each following legal requirements for population equality and contiguity.

Top 100 Plans Selected

For each jurisdiction, the fairest 25 plans were identified based on compactness, demographic balance, and population equality metrics.

Multi-Level Analysis

We analyzed Santa Clara County Board (5 districts), San Jose City Council (10 districts), City of Santa Clara City Council (6 districts), and Sunnyvale City Council (6 districts) as separate jurisdictions.

Results by Jurisdiction

Santa Clara County Board

50k+ Plans Generated
100 Top Plans
5 Districts

Analysis complete - ready for community review

San Jose City Council

10000 Plans Generated
25 Top Plans
10 Districts

Analysis complete - ready for community review

City of Santa Clara

10000 Plans Generated
25 Top Plans
6 Districts

Analysis complete - ready for community review

Sunnyvale

10000 Plans Generated
25 Top Plans
6 Districts

Analysis complete - ready for community review

How We Evaluated Each Plan

Compactness

Measures how geographically compact each district is. Higher scores mean more compact, logical shapes that respect natural boundaries and keep communities together.

  • Polsby-Popper Score: Measures the ratio of district area to perimeter, with higher scores indicating more compact shapes
  • Reock Score: Compares district shape to a circle of equal area, with higher scores being more compact
  • Combined Analysis: Using a combination of both metrics ensures districts have logical, community-friendly boundaries

Demographic Balance

Ensures fair representation of all communities using segregation indices (Dissimilarity, Separation, Isolation).

  • Dissimilarity Index: Measures racial/ethnic segregation between districts
  • Separation Index: Measures how isolated minority communities are
  • Isolation Index: Measures how concentrated minority populations are

Population Equality

Our algorithmic method generates plans that are always within 1% of perfect population equality. Once a map is approved by the community, it's easy to make minimal adjustments to achieve exact equality.

  • Algorithm precision: All generated plans maintain population within 1% of the target
  • Community approval: Plans are presented to the community for review and selection
  • Easy adjustment: Minimal tinkering is needed to achieve exact population equality
  • Legal compliance: Final plans meet all federal and state population requirements

Our Top Plans

Below are the top redistricting plans for each jurisdiction. Each plan represents the fairest possible district boundaries based on our algorithmic analysis.

Santa Clara County

County Board Districts
Santa Clara County Top Redistricting Plan

San Jose

City Council Districts
San Jose Top Redistricting Plan

Sunnyvale

City Council Districts
Sunnyvale Top Redistricting Plan

City of Santa Clara

City Council Districts
City of Santa Clara Top Redistricting Plan

Note: All 100 plans for each jurisdiction are available for public review. The complete dataset is publicly available on our GitHub repository.

The Impact on Santa Clara County

Community Representation

Our plans ensure that all communities in Santa Clara County have fair representation, from the tech corridors of San Jose to the residential neighborhoods of Sunnyvale.

School District Alignment

By creating compact districts, we help align electoral boundaries with school districts and other community institutions.

Transparent Process

Every step of our analysis is documented and publicly available, setting a new standard for redistricting transparency.

What's Next?

From Analysis to Action

Our Santa Clara County analysis provides a blueprint for fair redistricting that can be applied to other communities across California. The next steps include:

  • Community Engagement: Presenting our findings to local officials and community groups
  • Policy Adoption: Working with local governments to adopt fair redistricting processes
  • Expansion: Bringing our methodology to other counties and cities
  • Education: Training community members to understand and advocate for fair redistricting

Analysis Complete

100+ fair plans identified

Community Review

Public feedback and input

Policy Implementation

Adoption by local government

Ready to Bring This to Your Community?

Our Santa Clara County success shows that algorithmic redistricting works. Let's bring fair maps to your city or county.